

THE ASK:
Research & Illustrate statistical data for readers of The Independent Florida Alligator.
THE ANSWER:
Expressive, colorful data visualizations focused on viewer immersion. Graphics express not only the numbers, but the story behind them and why they matter to the readers of The Alligator.
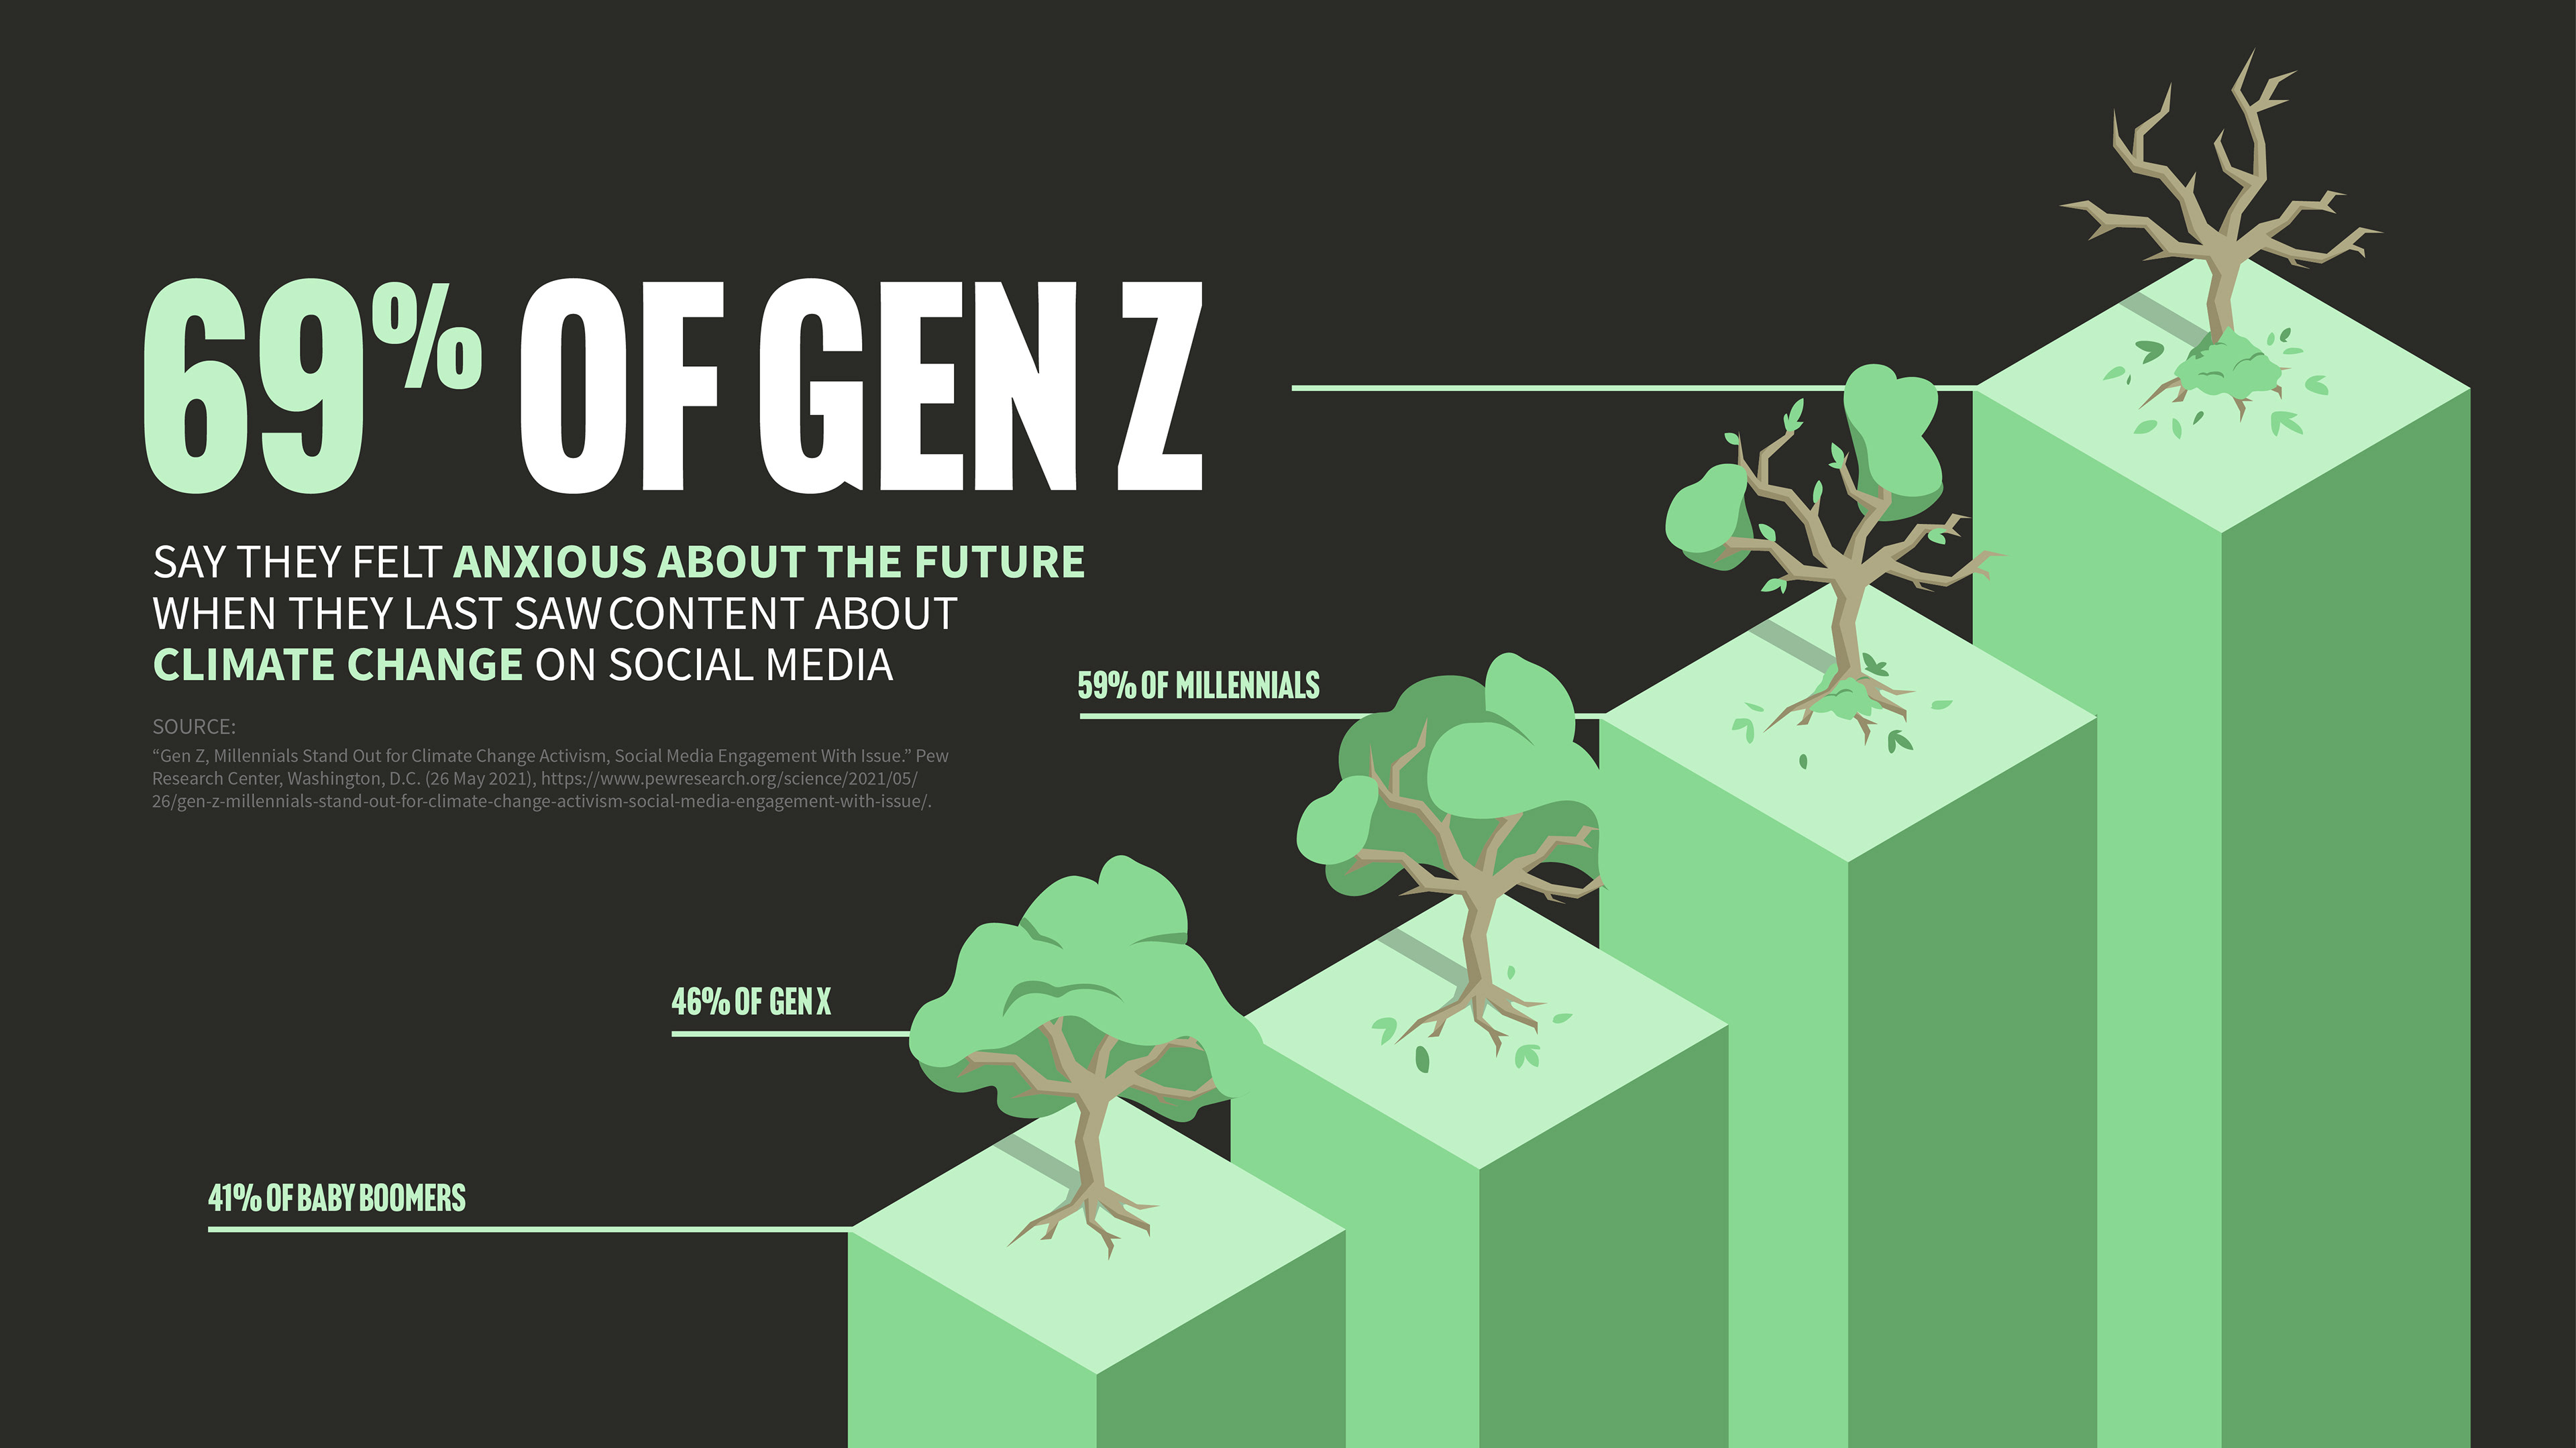
Data visualization for an article on Gen Z and climate doomscrolling.
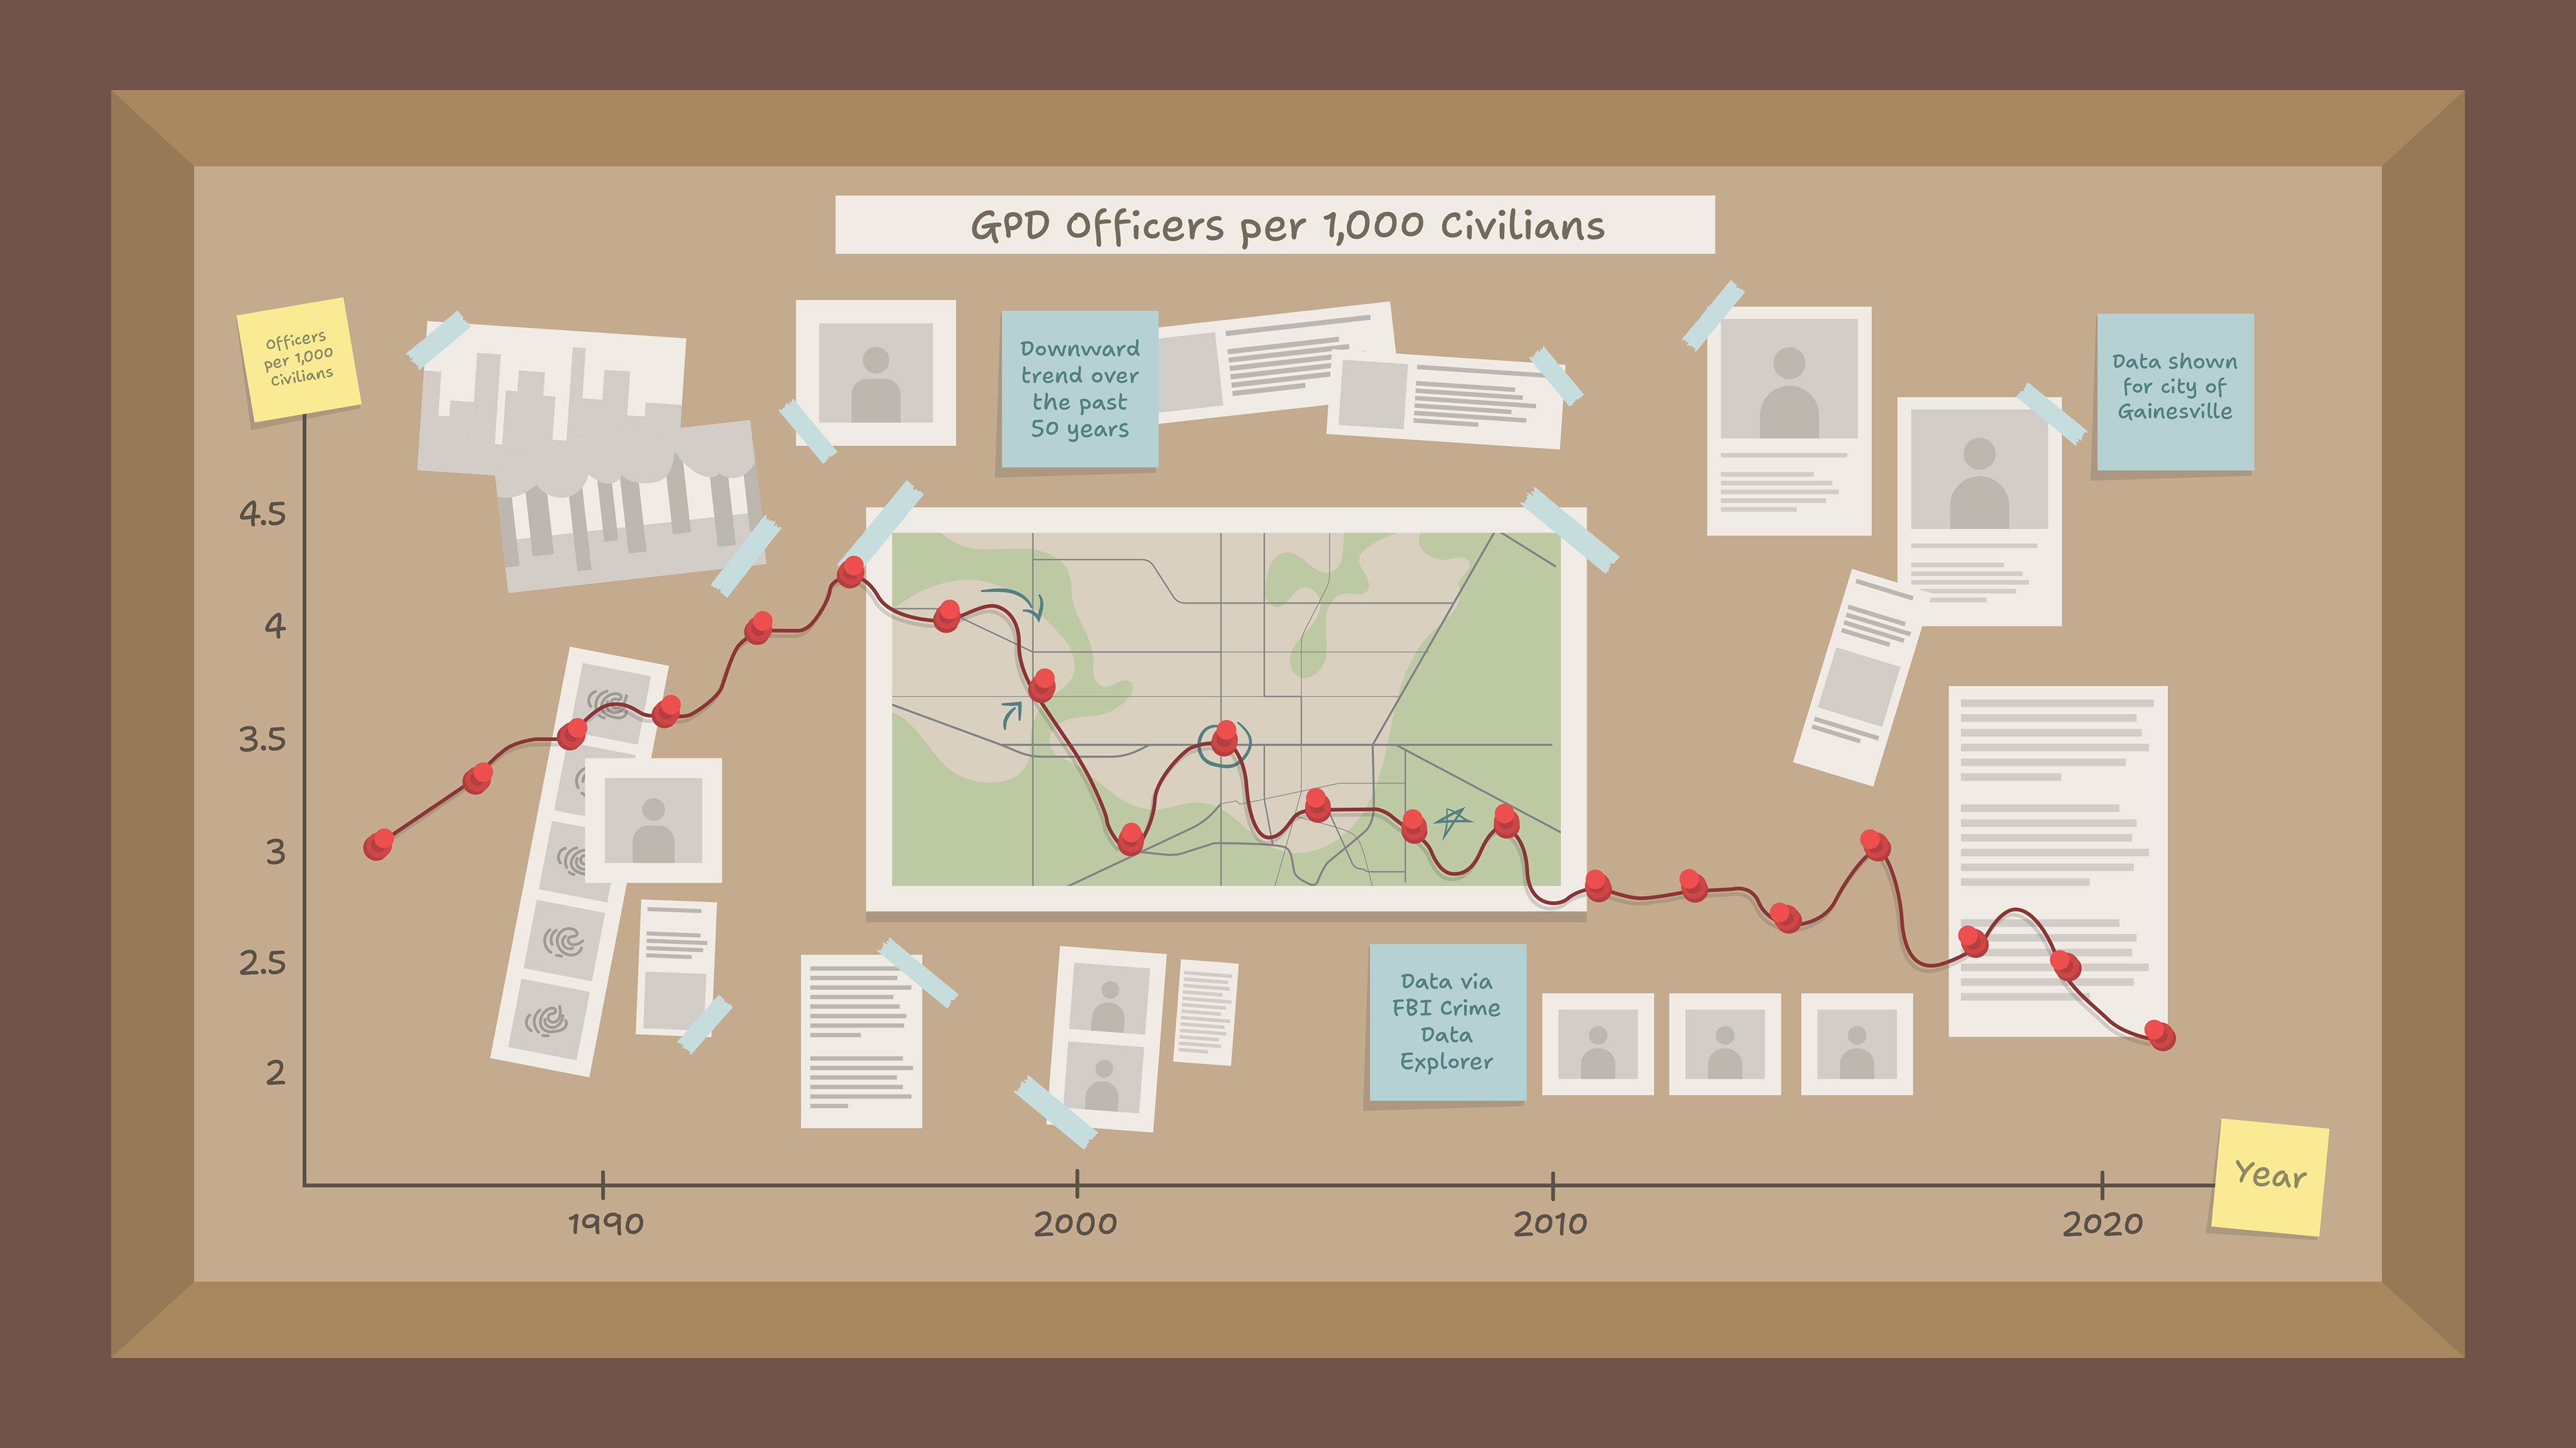
Data visualization for an article on short staffing at the Gainesville Police Department.

Data visualization for an article about complaints at Baker County ICE Detention Center.
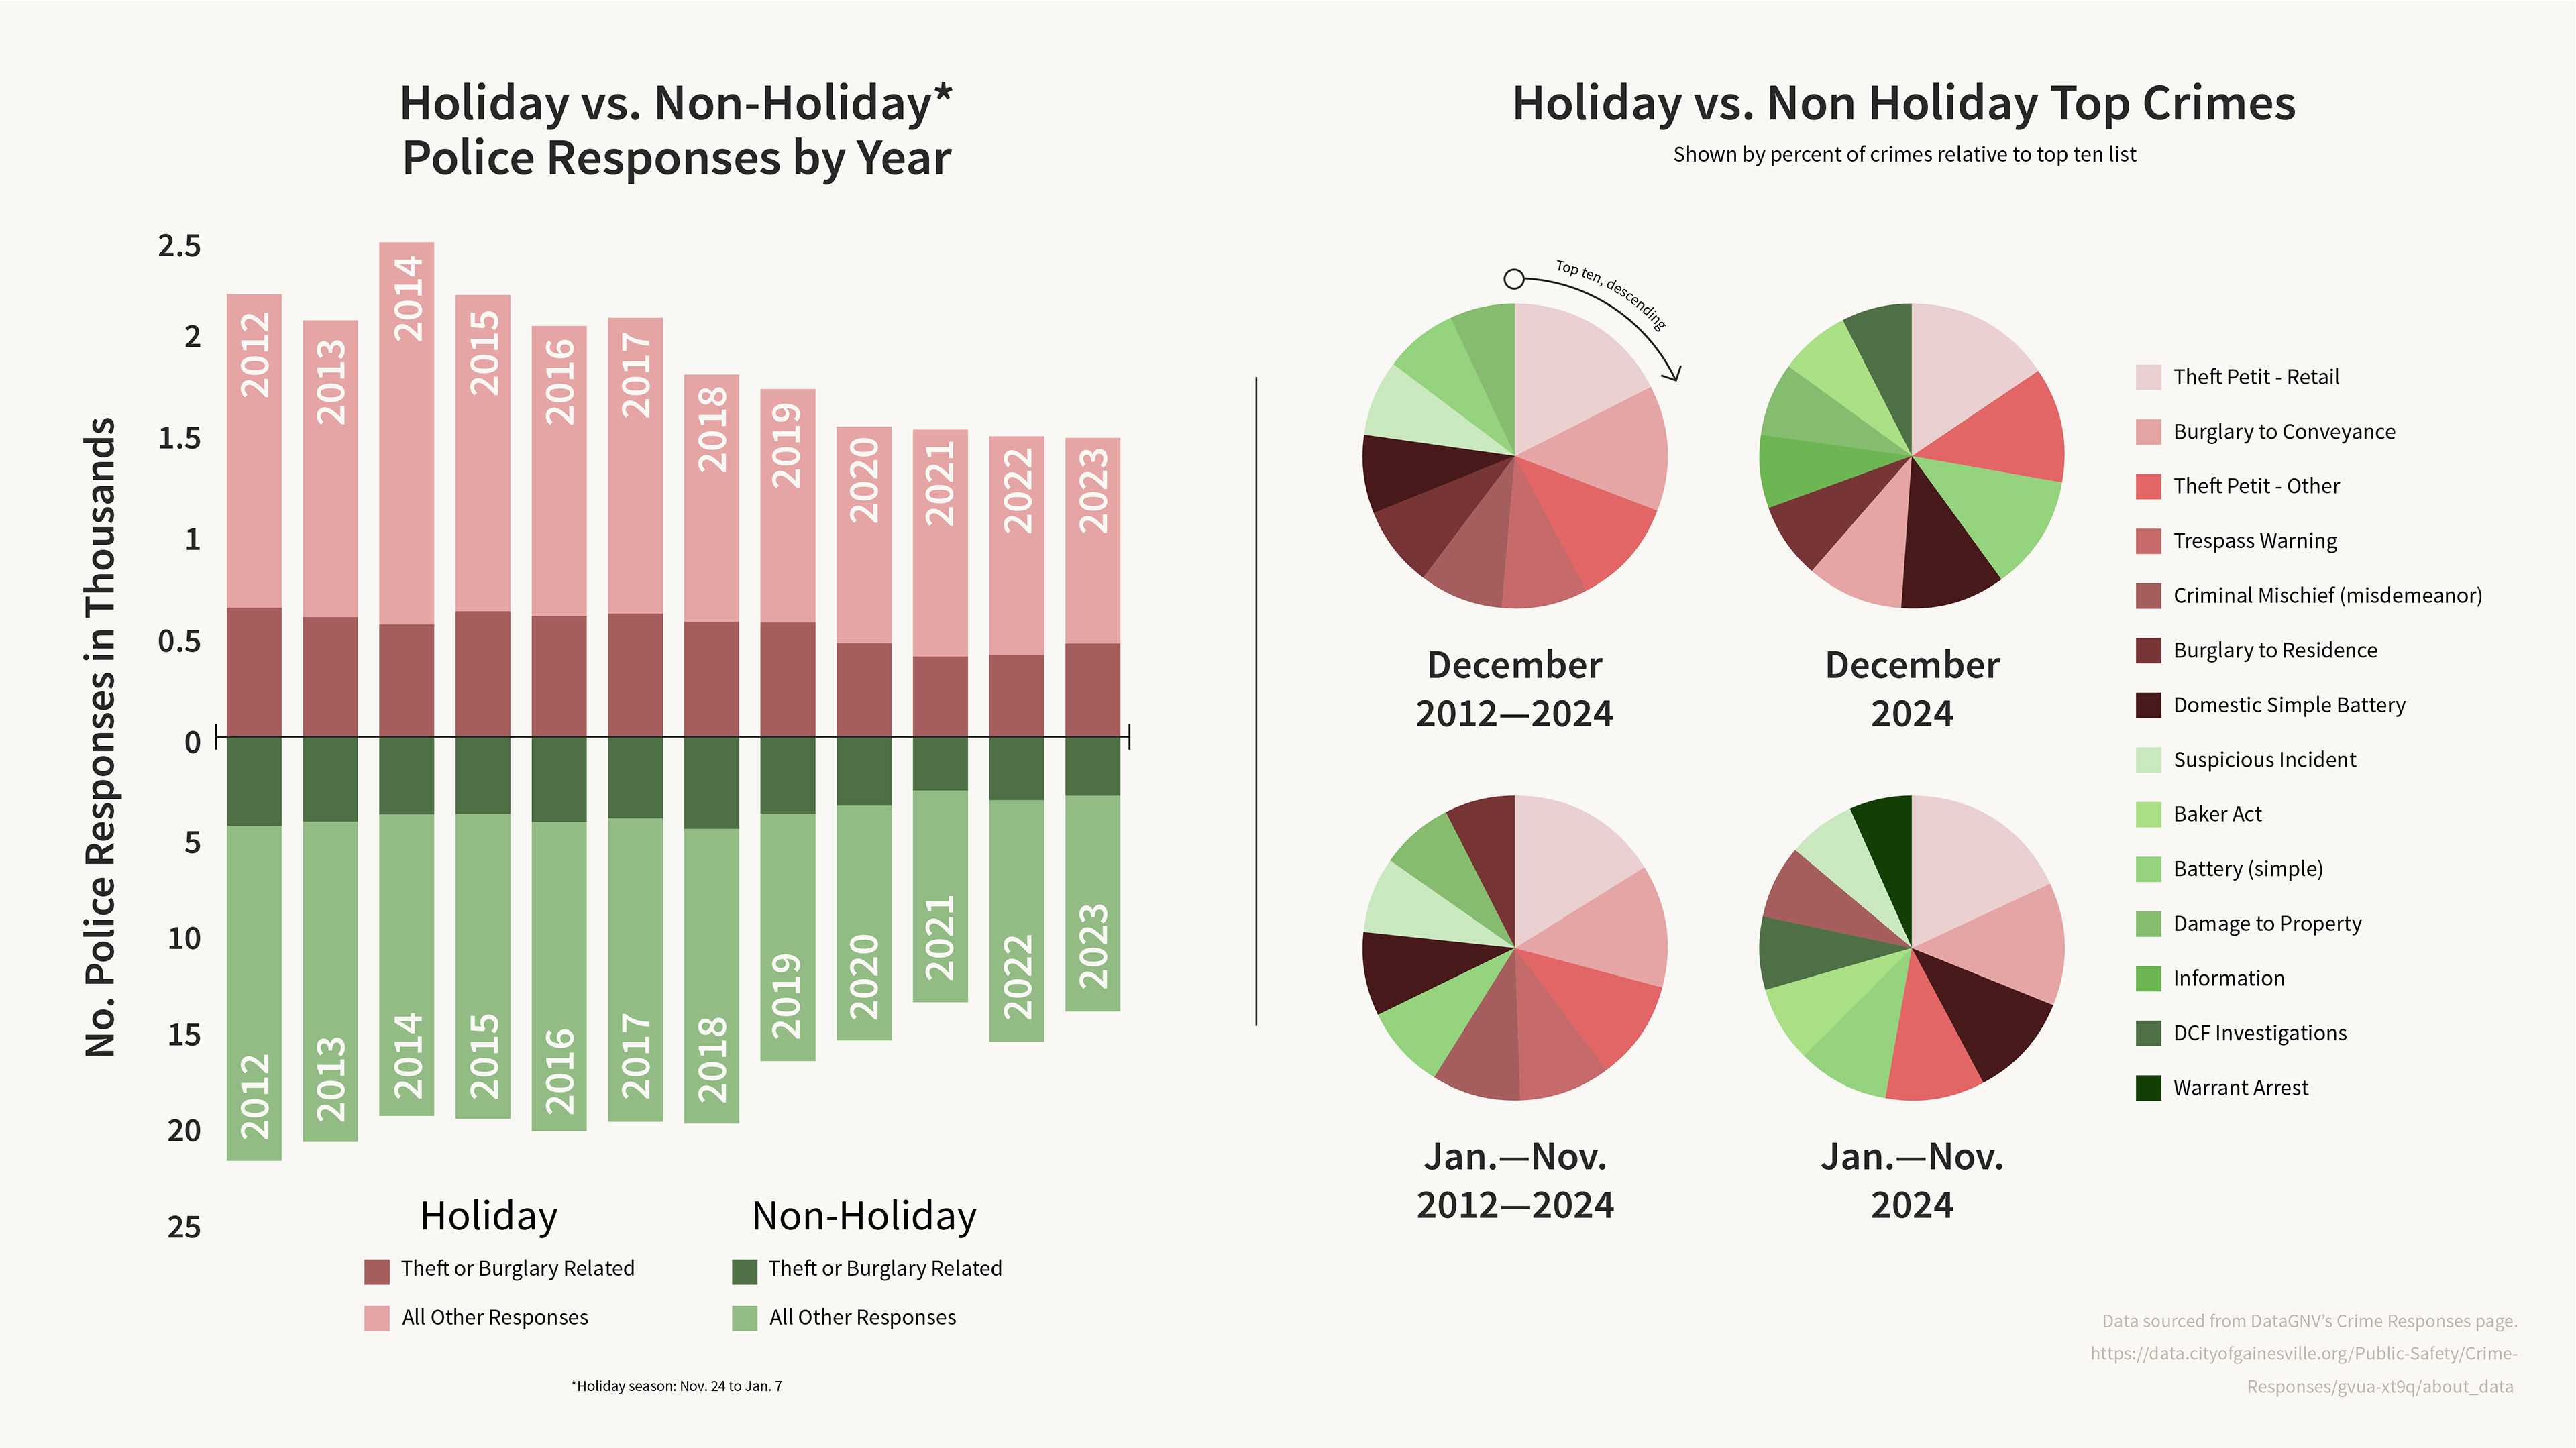
Data visualization for an article on holiday crime trends.

Data visualization for an article on sports betting.